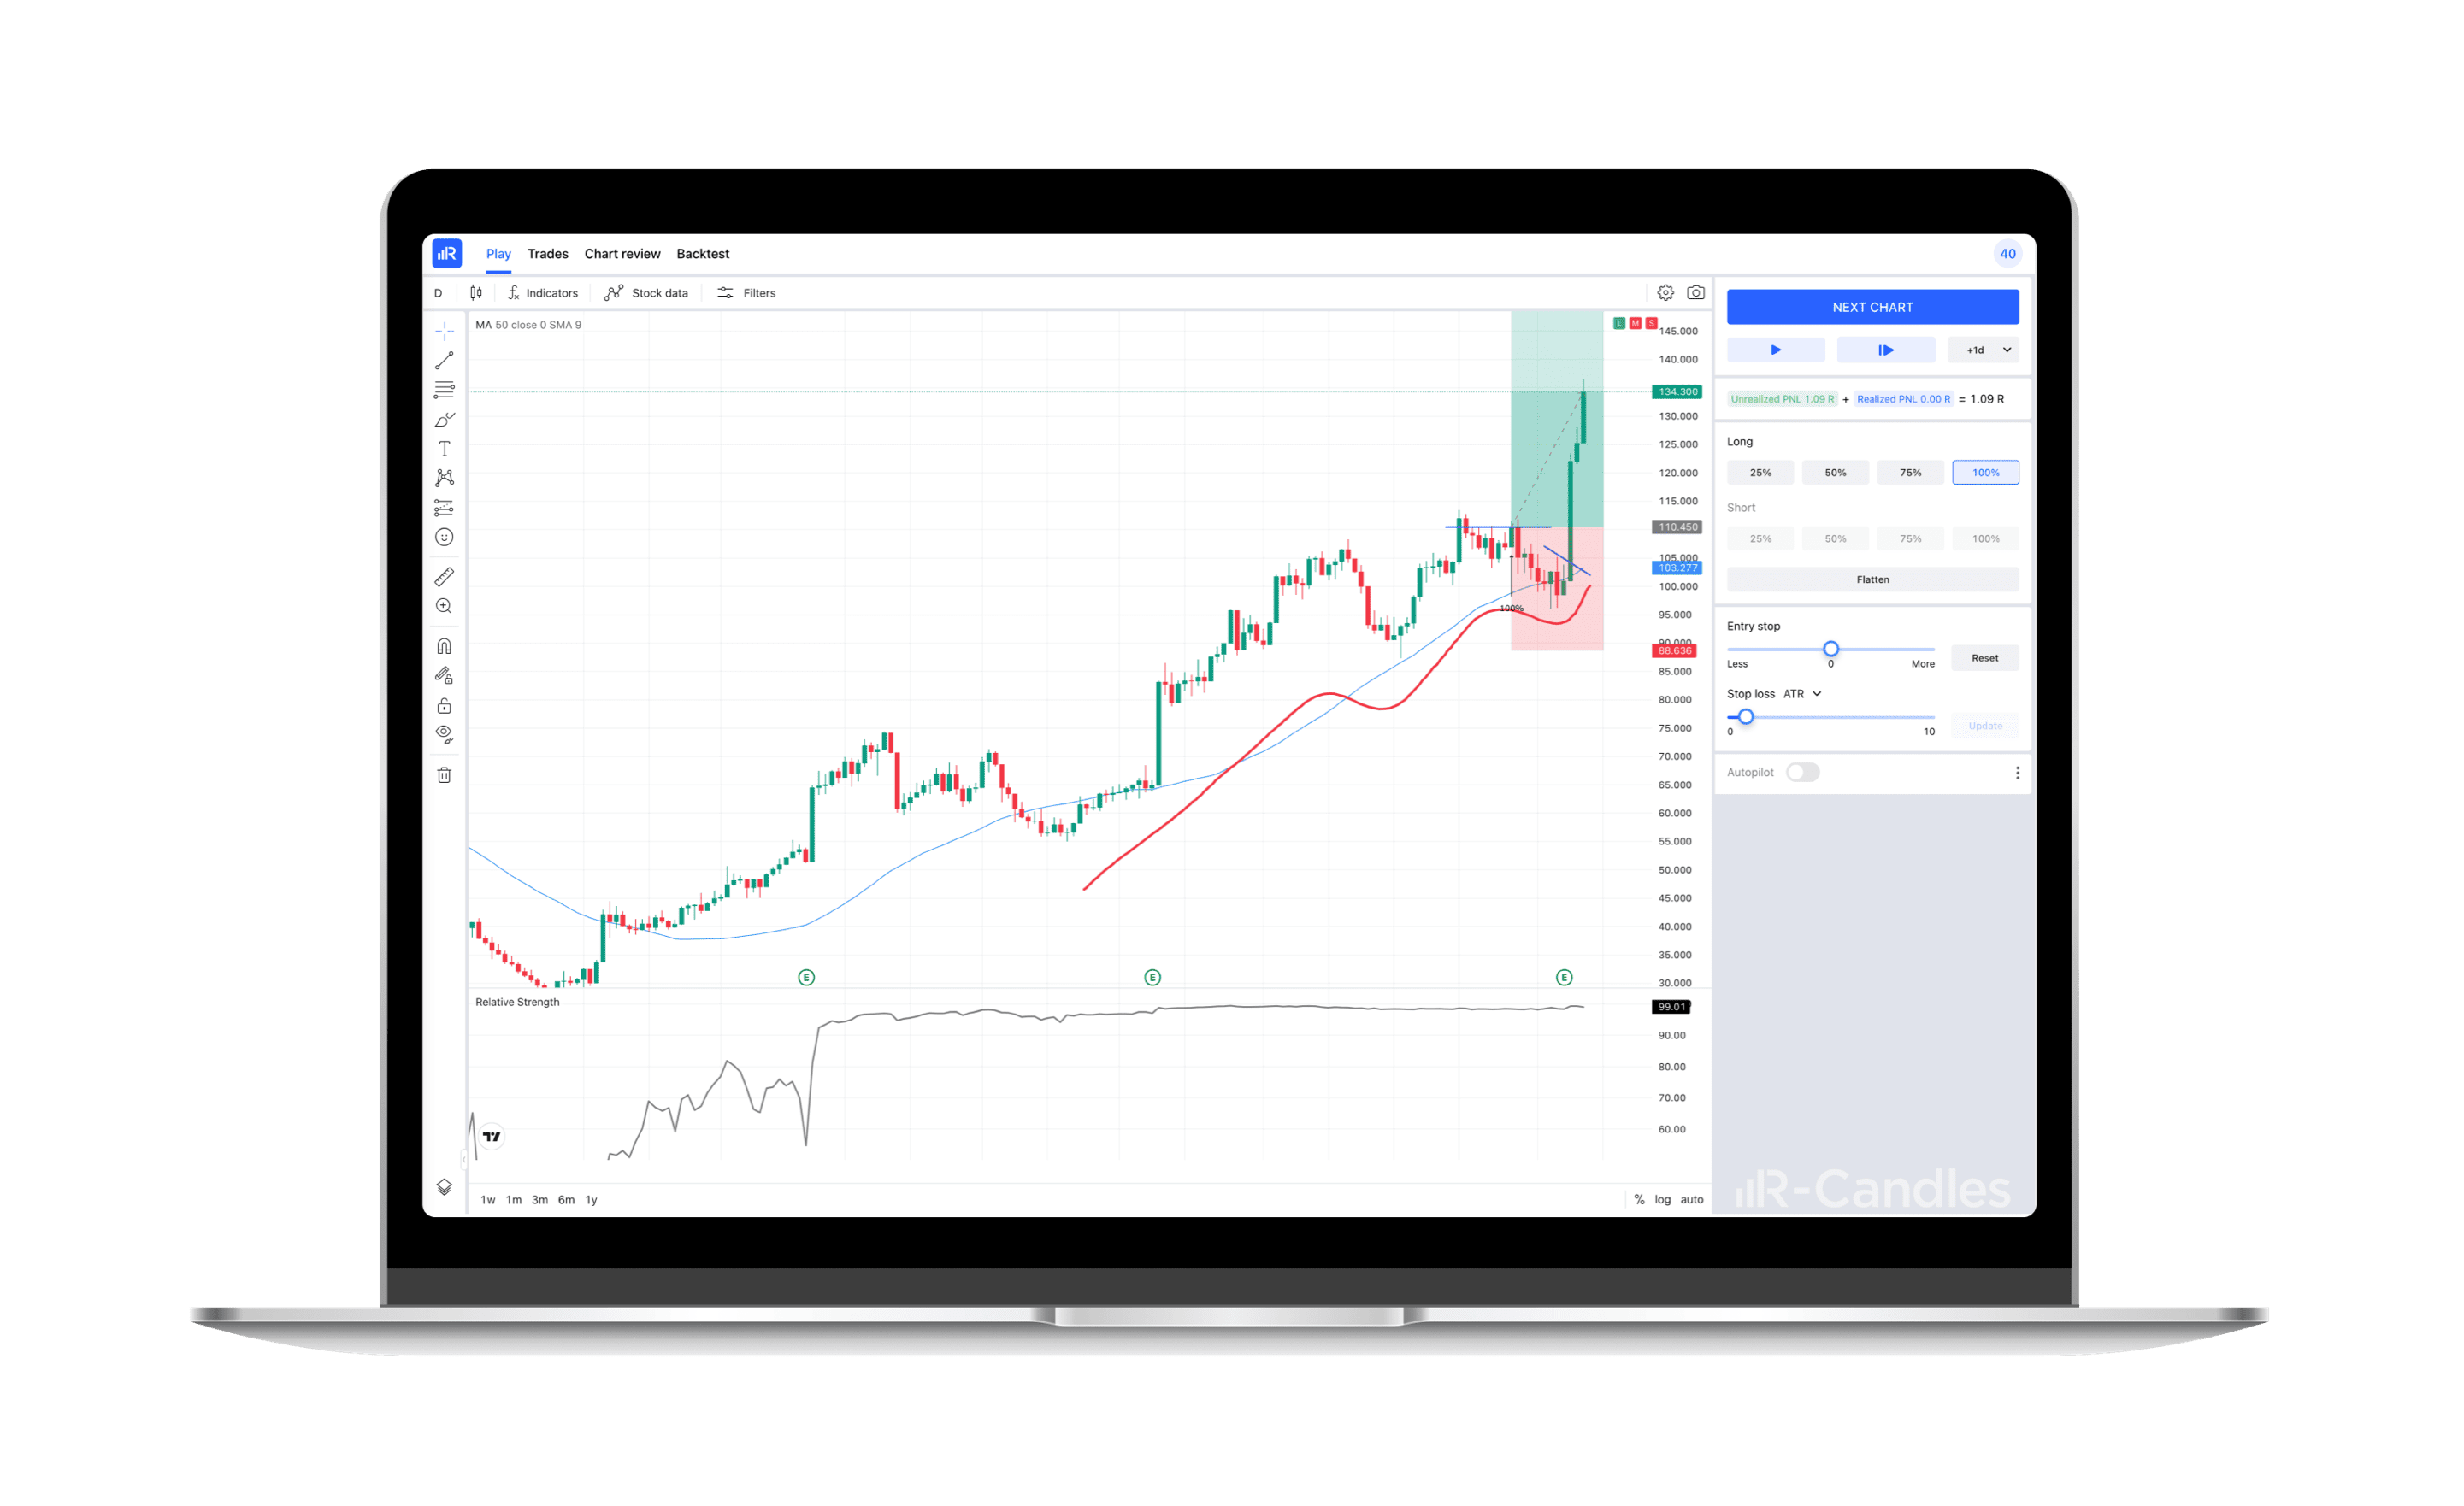
Trading backtester
and simulator
Made for discretionary traders.
Totally free, no downloads required.
A bias-free environment.
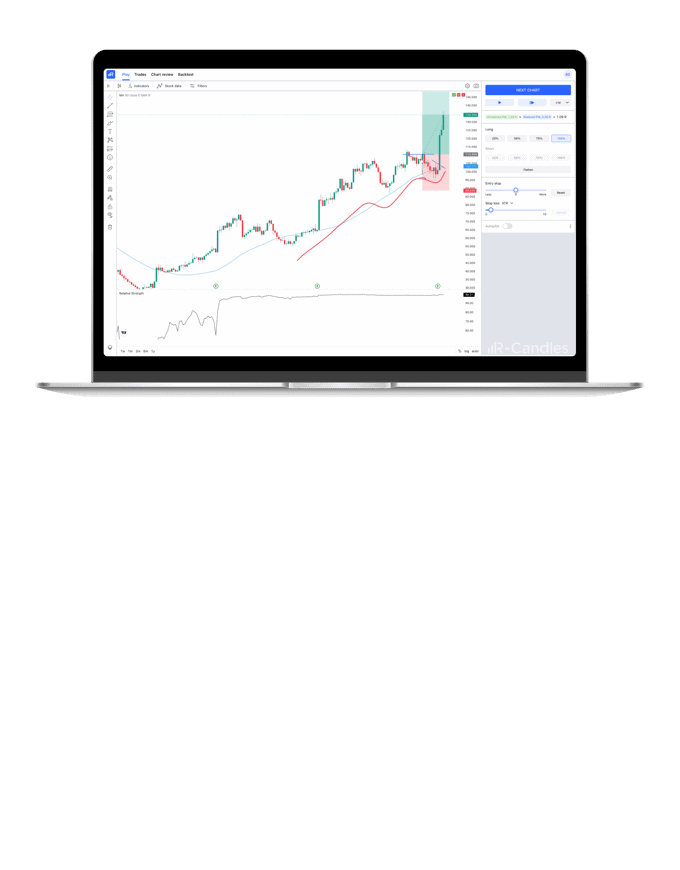

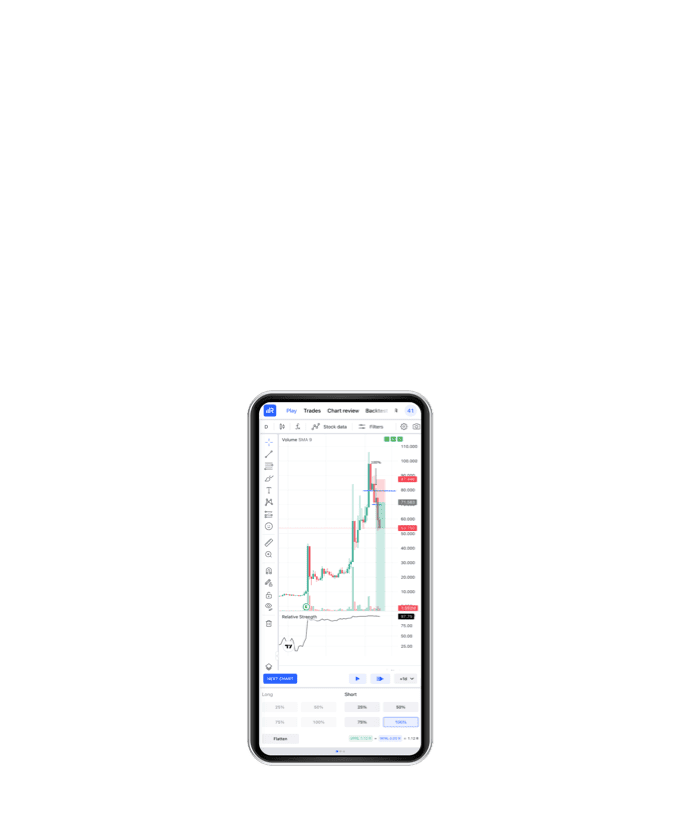
How does R-Candles work?

What makes R-Candles great

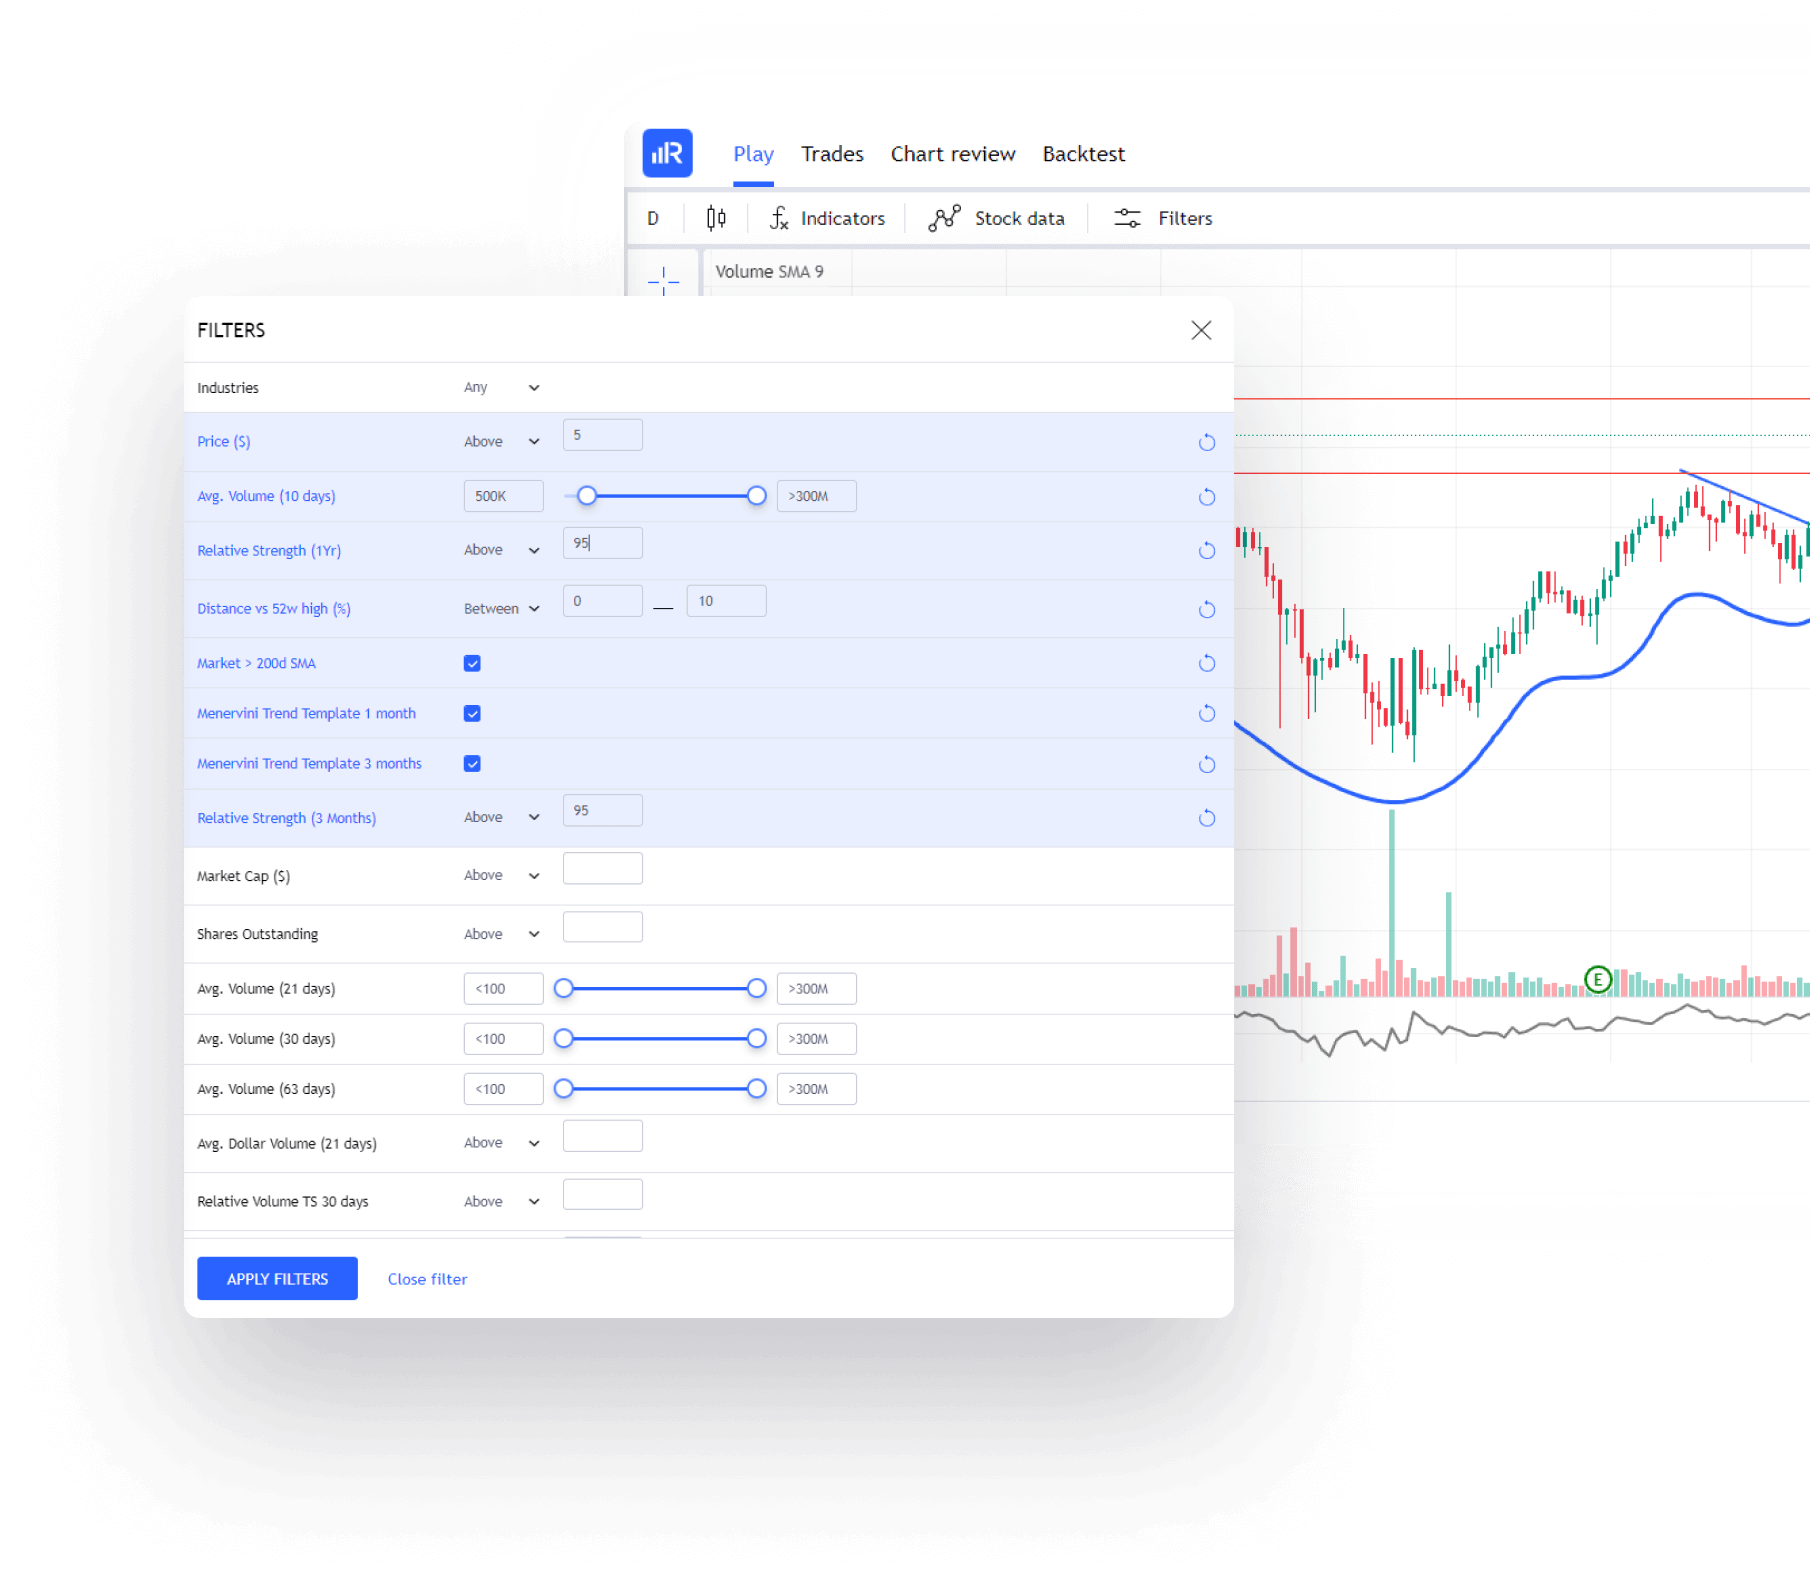
The market exhibits consistent patterns over time. R-Candles makes the most comprehensive US historical charts database at your disposal, enabling you to scan and analyze it using over 50 filters. The more you delve into it, the further ahead you'll be!

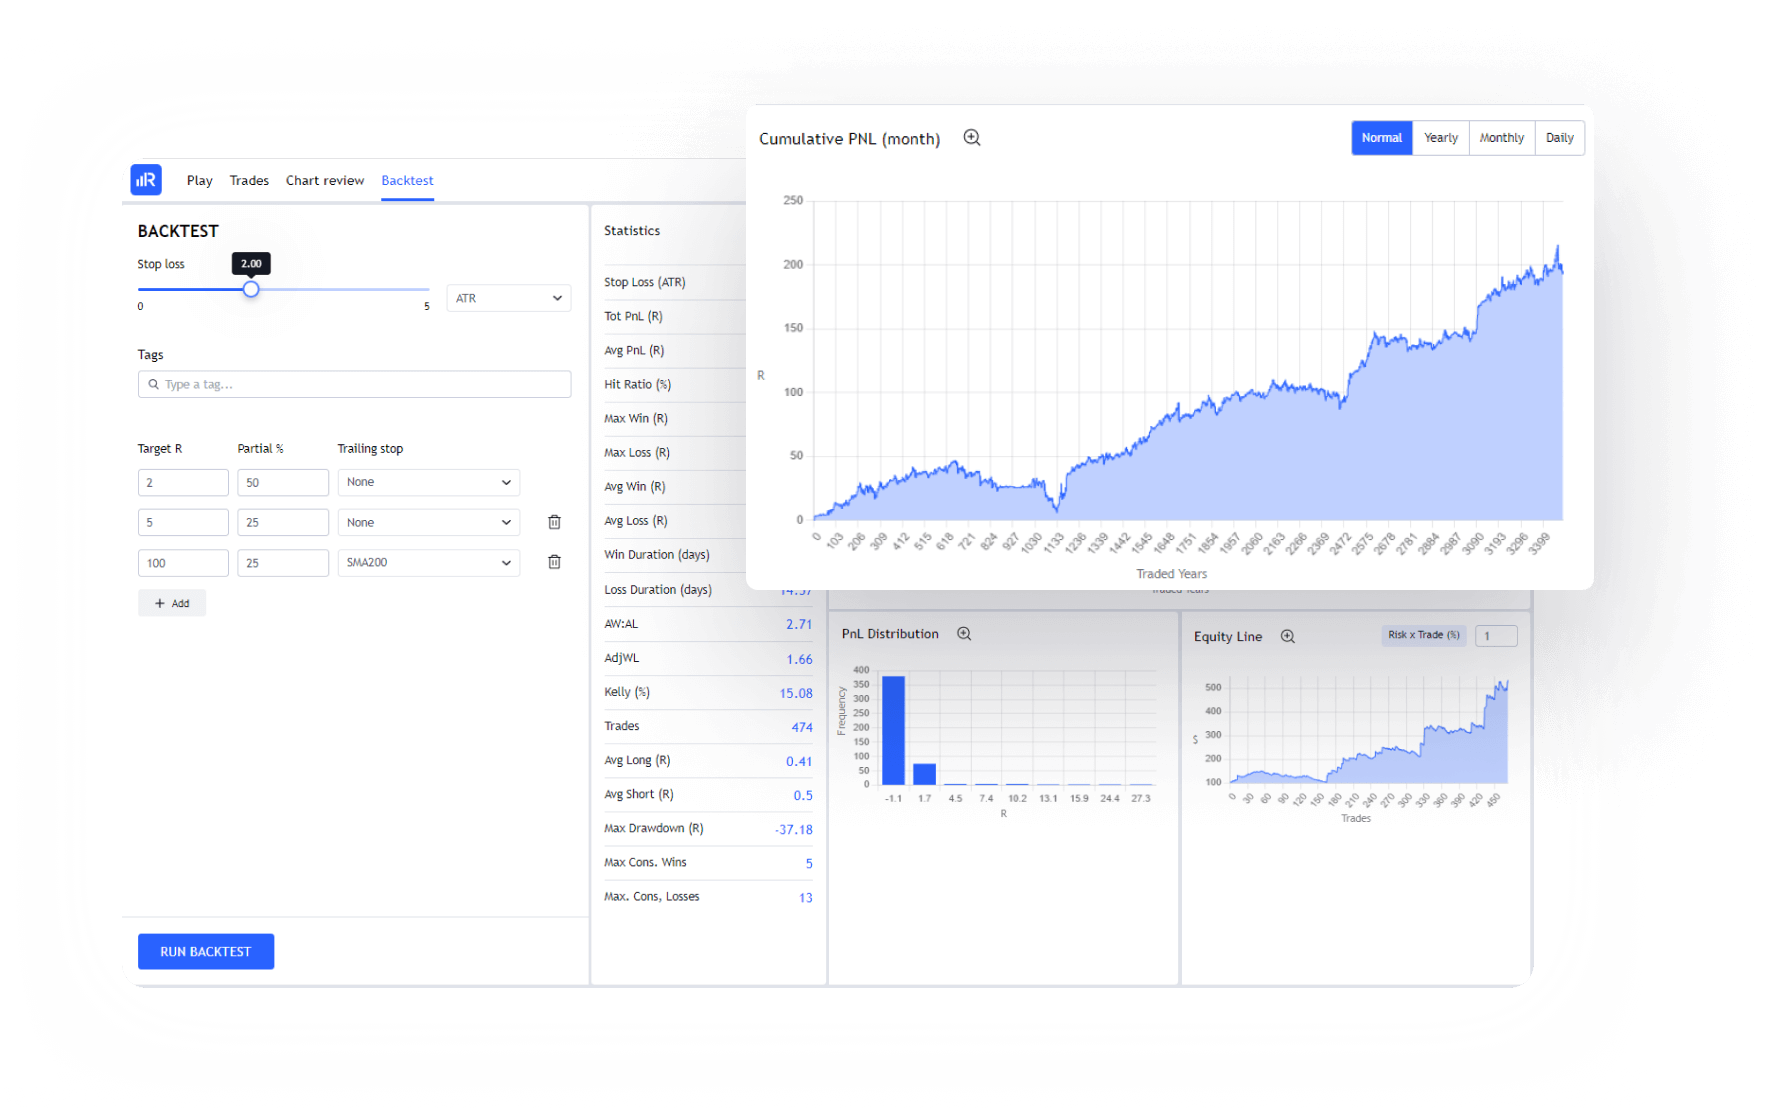
Study your performance statistics, including returns, profitability, risks, and other indicators that reflect the effectiveness of your trading strategies. Analyzing this data is essential for evaluating and refining your strategy while setting realistic expectations when trading in real markets.

Review all your previous trades, filter them using the tags you've already assigned, and experiment with alternative strategies by adjusting target parameters. Evaluating the effectiveness of a strategy and identifying its strengths and weaknesses will help you make well-informed decisions about its potential future applicability.

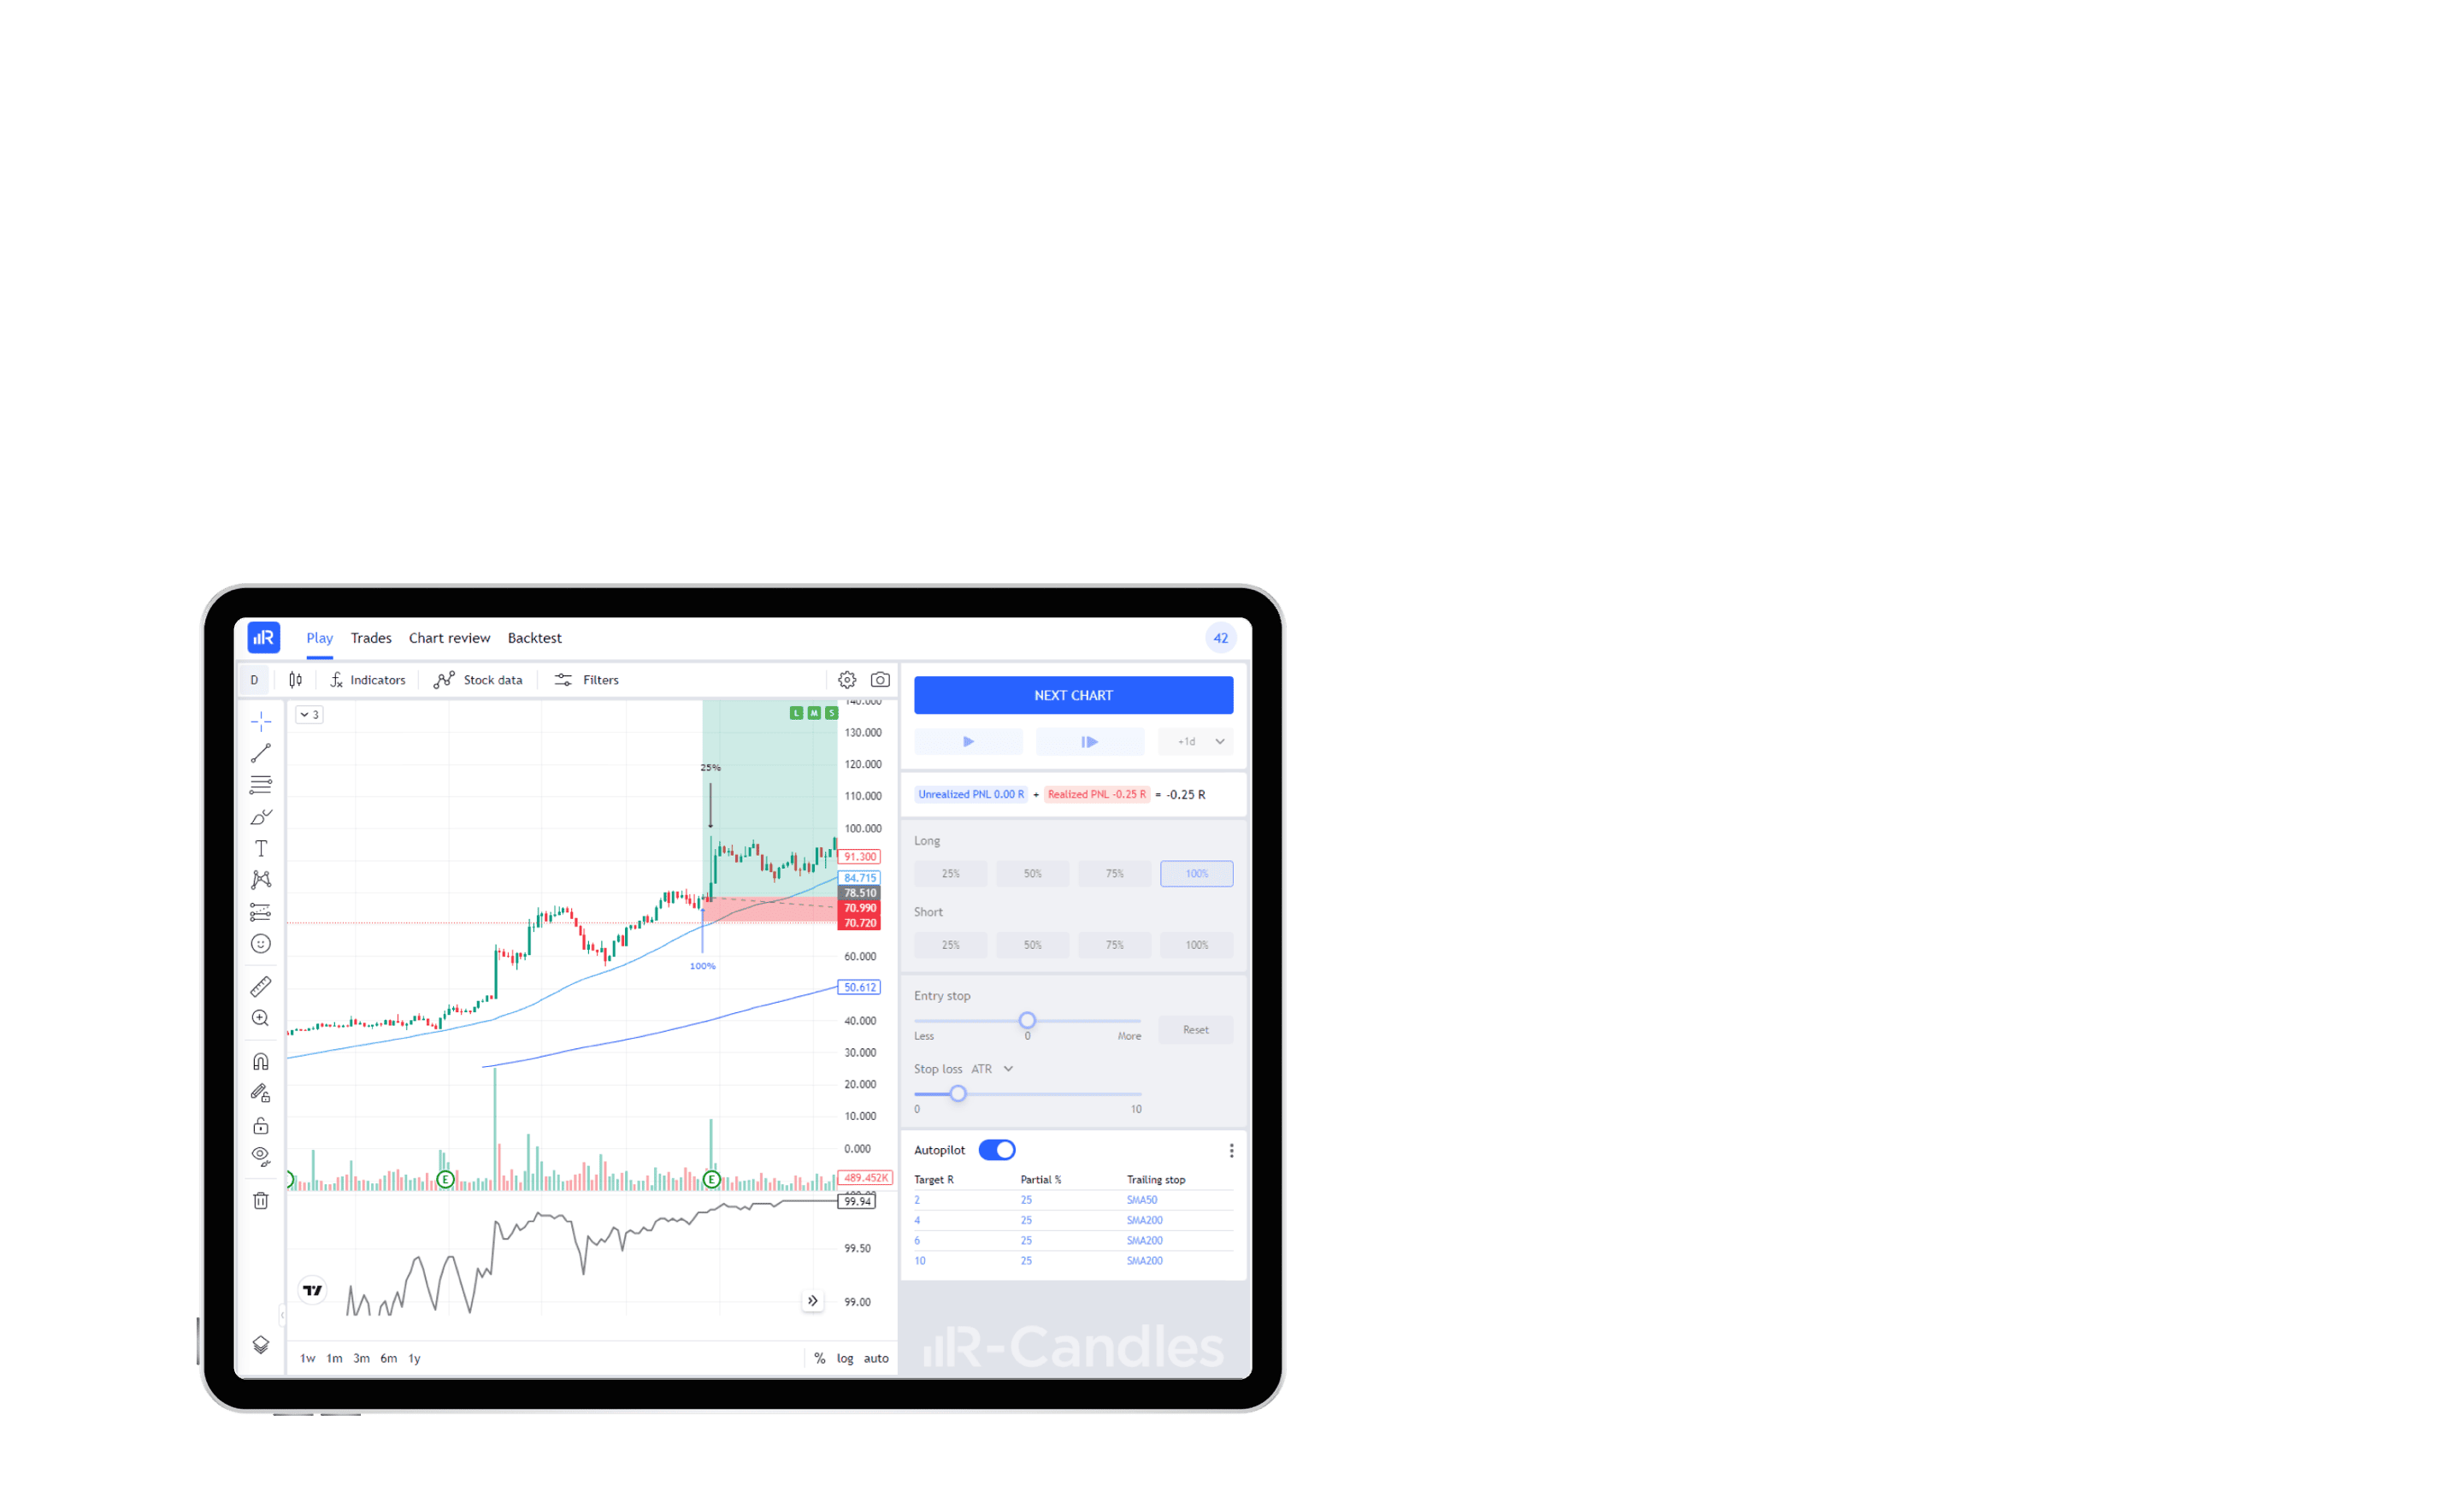
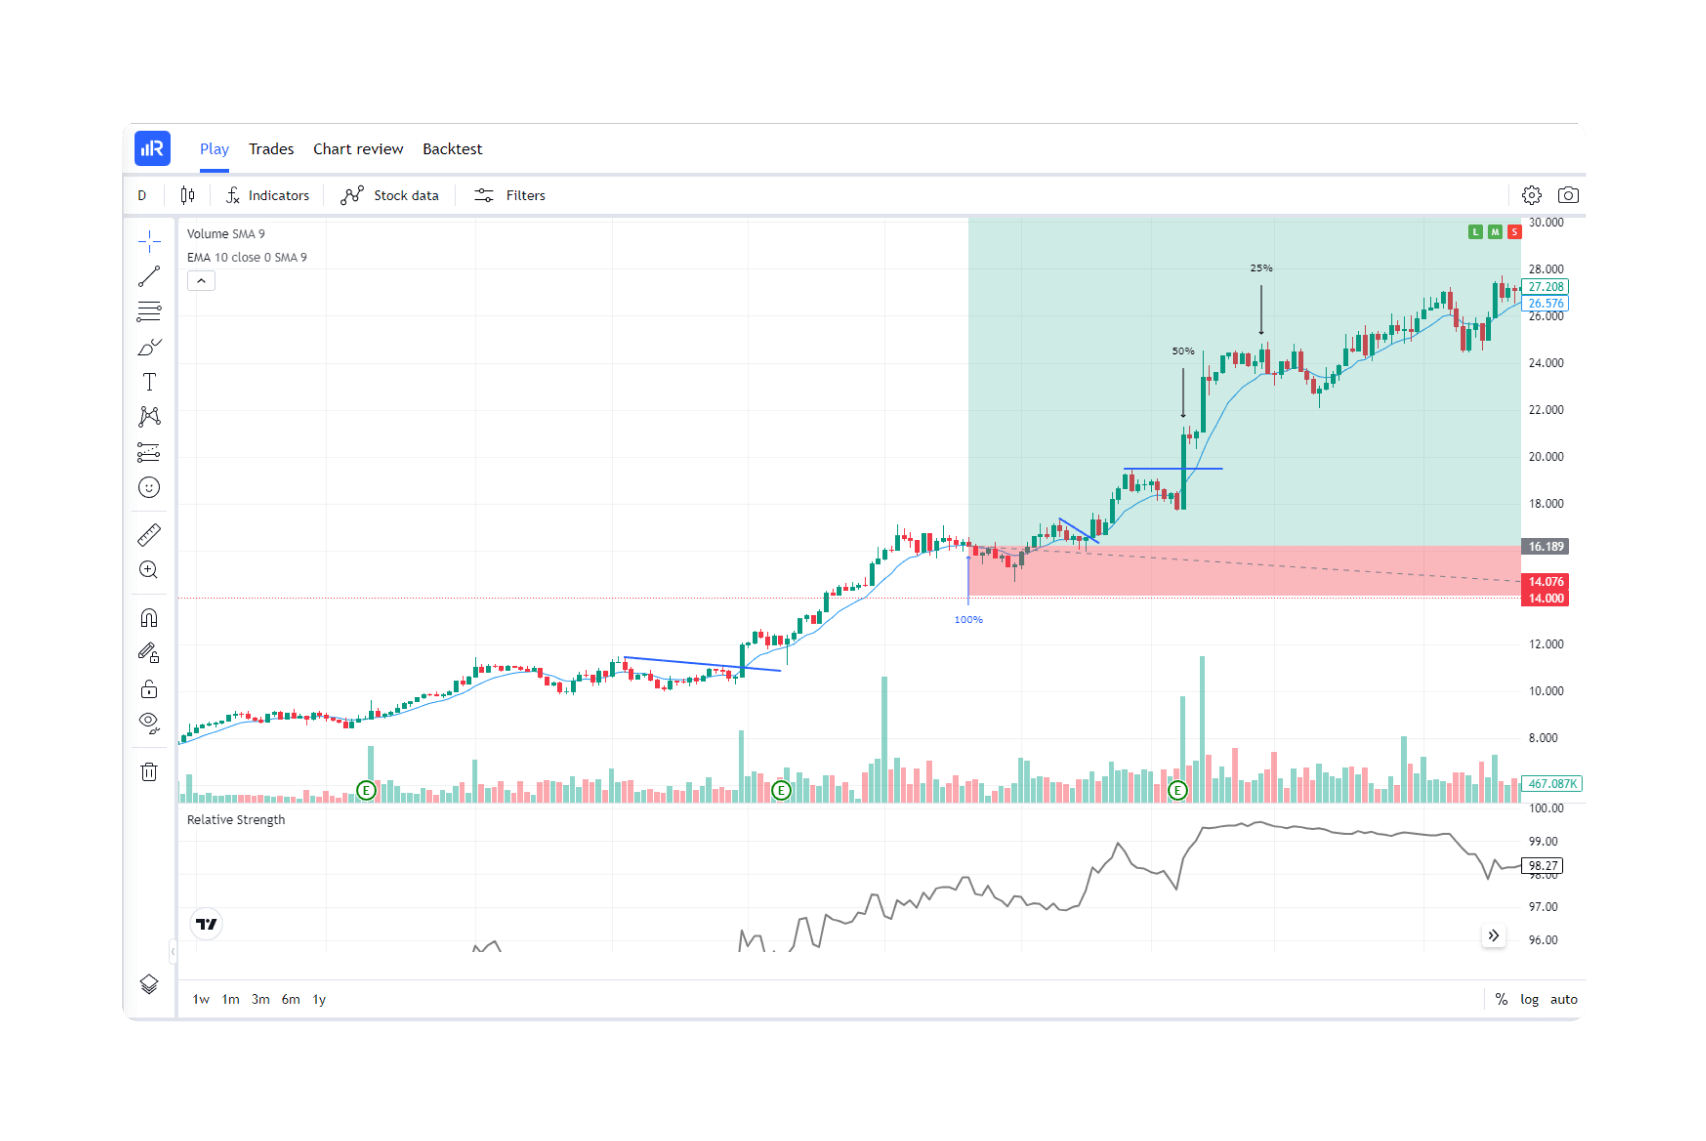
Simulate trades using realistic order types: use stop orders to enter into a new trade and to define your max loss; exploit limit orders to set your profit targets.

Does your trading strategy depend on market regimes? Studying the profitability of your trades based on market regimes will help you dynamically adjust your trading style in real markets.

Enter your trades and let the auto-pilot manage your positions according to pre-defined targets and stops. You can do in just a few minutes what would otherwise take hours and hours!

Tag your simulated trades to study your trading setups, scenarios, or market conditions more effectively. These tags will assist you in identifying the strategies where you are most profitable and those where you should refine your trading criteria.

Optimizing exit criteria is critical for a successful trading strategy. The better you manage exits, the more you'll achieve favorable outcomes in the long run.

Exploit historical earnings announcement days to learn how to trade Episodic Pivots.
What set R-Candles apart
What they say of us
R-Candles is a must-have for discretionary technical traders that rely hugely on price and volume analysis.
If you're a swing trader or position trader, you need this tool. It lets you practice on historical charts easily and enjoyably.
You won't regret getting it.
Highly recommended!
A game-changing software that elevates your trading skills. Stop wasting your time studying historical charts manually.
I use this software to train on Minervini/O'Neill/Quallamagie patterns, and my confidence has skyrocketed.
Whether you're a novice or an experienced trader,
you'll definitely benefit from it!
Faqs
R-Candles utilizes the most comprehensive US stock database. Charts are randomly chosen from this database and displayed without ticker or date information to prevent any forward-looking bias. With R-Candles, you can analyze trade statistics and unlock hidden alpha via a powerful backtester.
You can trade as many setups as you like. You can use tags to study historical trades based on different trading setup and run the backtester tool to find the best exit rules for each trading setup.
Yes, R-Candles database contains accurate and complete data that takes into account both currently listed stocks and those that have failed or been delisted from the market.
Yes, you can readily export them in CSV format.
You can use R-Candles for free: simply create an account and start improving your trading skills!
R-Candles can be defined as the best swing trading simulator: it is suitable for swing and position traders who heavily rely on technical analysis (price and volume).
You can simulate various technical setups, including breakouts, VCP, episodic pivots, parabolic reversals, flags, pennants, gaps, head and shoulders, double tops, double bottoms, cup and handle patterns, low cheats, triangles, boxes, and many others.
about R-Candles?
